

It is one of the most popular indicators among intraday traders. VWAP stands for Volume Weighted Average Price. As the name suggests, it averages the price data weighted by volume. It is an indicator which is exclusively used for intraday. This indicator resets at the start of each day. It is an overlay indicator and looks very similar to a moving average.
Like moving averages, this indicator also lags prices. Generally, when the prices are above VWAP, it indicates a bullish trend and when the prices are below the this indicator, it indicates a bearish trend. Institutions actively use this indicator to place their orders. As the indicator is volume weighted, it helps them identify liquid and illiquid price points so that they can fulfill their large orders without disrupting the market.
In this webinar, we will focus on applications of the indicator. We will see three ways in which the indicator can be used to create trading strategies.
1) VWAP Crossover System
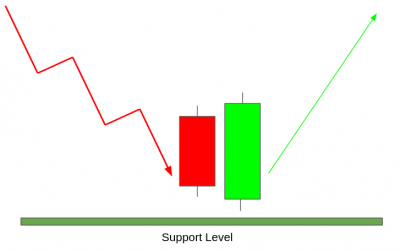
As the indicator typically shows the average price, if the price crosses above the indicator, it indicates that the market is now ready to pay a higher than average price. As the buying interest increases, we can see a sustained movement in the direction of the crossover due to the beginning of a new trend. In this strategy, we will explore how we can benefit from this.

Strategy Link: https://public.streak.tech/in/QfgwbbbqHO
Timeframe: 15 mins
Chart Type: Heikin-Ashi
Holding Type: MIS (Intraday)
Entry Condition: Buy when a candle crossed above VWAP and the next candle closed above the high of the candle that crossed above VWAP.
Exit Condition: Stoploss of 1% OR Target of 2%
In this strategy, we are entering based on the confirmation of the VWAP crossover. First we are checking if the price has crossed above VWAP i.e the market is ready to pay a higher price for purchasing the stock than the average and then we wait for the next candle to close above the high of the crossover candle, confirming the move. We have used the Heikin-Ashi chart to smoothen the price movement.
2) VWAP Crossover with its moving average
Moving average indicator is typically applied to the price data. However we can also apply MA indicator over any other indicator such as RSI, VWAP, MFI etc. The interpretation will be similar to that of a Moving Average on price data. When we apply the moving average over VWAP, it will smoothen the indicator. When the VWAP indicator crosses above its moving average, that means that the average price that the market is willing to pay is in an uptrend that in turn indicates that the stock is in a bullish trend. We will create a strategy based on this theory.

Strategy Link: https://public.streak.tech/in/fQFIUnIhLb
Timeframe: 5 mins
Chart Type: Candlestick
Holding Type: MIS (Intraday)
Entry Condition: Buy when the VWAP indicator crosses above the Exponential Moving Average 21 of the VWAP indicator.
Exit Condition: Stoploss of 1% OR Target of 2%
3) VWAP Slope
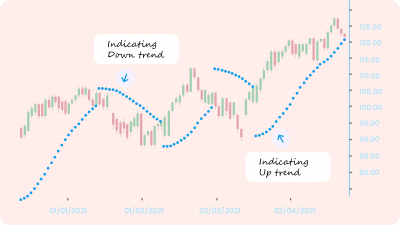
As the VWAP indicator represents the average price, the slope of the indicator can help gauze the trend. Increasing VWAP indicates that the average price that the market is willing to pay is constantly increasing which in turn means that the demand for the stock is increasing leading to a bullish trend. Similarly, decreasing VWAP indicates that the average price that the market is willing to pay is constantly decreasing which in turn means that the demand for the stock is decreasing. In our next strategy, we will use VWAP slope to gauze the trend.

Strategy Link: https://public.streak.tech/in/b1qOAUi0mI
Timeframe: 5 mins
Chart Type: Candlestick
Holding Type: MIS (Intraday)
Entry Condition: Sell when VWAP has been falling for the last 4 candles and MACD crosses below MACD signal.
Exit Condition: Stoploss of 1% OR Target of 2%
In this strategy, we are checking if the VWAP has been falling, indicating a bearish trend. Then we wait for the MACD to cross below the MACD signal line, indicating a shift in momentum to bearish.
Conclusion
VWAP is a very important indicator for intraday traders. The indicator looks very similar to a moving average. In this article, we have discussed three different ways in which the indicator can be used and we also created strategy based on the same. For any queries, you can reach out to us at [email protected]
Disclaimer: The information provided is solely for educational purposes and does not constitute a recommendation to buy, sell, or otherwise deal in investments.