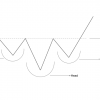

This is an overlay indicator that creates a band around the price. The upper band is N period high and the lower band is the N period Low. The indicator also consists of a center line, which is the mean of the two lines. The indicator resembles the bollinger bands however the lines in the donchian channel are less choppy as compared to the bollinger bands.
Richard Davoud Donchian created the indicator. He is widely regarded as the father of the managed futures industry, and he is known for creating a systematic method to futures money management. He also popularized the notion of mutual funds. For his achievements, he is often referred to as “The Father of Trend Following.”
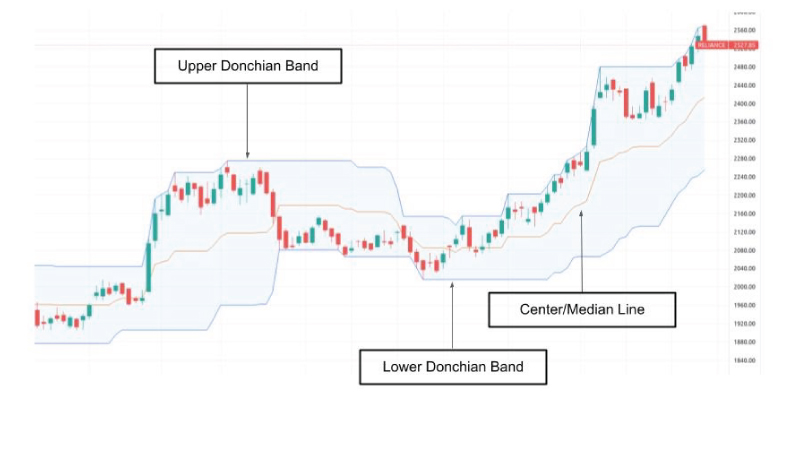
Donchian Channel in Action

Calculations
Upper Channel Band = Highest High in Last N Periods
Eg. 20 Period Upper Band = Highest High in last 20 candles.
Lower Channel Band = Lowest Low in Last N Periods
Eg. 20 period Lower Band = Lowest low in last 20 candles
Center/Median Line = (Upper Band + Lower Band) / 2
Interpretation
Close above Upper Band = Price has broken above N period high
Close below Lower Band = Price has broken below N period low
Rising Upper Band = N period high is rising
Falling Upper Band = N period high is falling
Rising Lower Band = N period low is rising
Falling Lower Band = N period low is falling
Depending on the market conditions, the indicator can be used for trend following as well as for identifying overbought and oversold levels. In a trending market, close beyond the bands signals a beginning of a new trend. And in a sideways market, the close near the bands can be used to identify overbought and oversold conditions.
The values of the channel lines will change whenever a new N period high/low is established. The indicator can also give a fair indication of the volatility. If the bands are wider, the volatility is high and if the bands are narrow, the
Creating Strategy with the Donchian Channel on Streak
In this section, we will learn how we can use the Donchian Channel indicator on the Streak platform to create, backtest and trade with strategies.
This is a very simple MIS (Intraday) strategy on a 5 min time frame. The strategy tries to enter when a new trend appears to emerge. A buy entry is taken when two consecutive candles close above the upper channel line of the Indicator. Exit is based on Stoploss and Target.
Buy Entry : Two Consecutive Candles close above upper channel line
Sell Exit : 1 % Stoploss is hit or 2% Target is hit
Conditions of the strategy:

Parameters of the strategy:

Backtest Results:

Conclusion
Donchian Channel is a popular Indicator. It may be utilized for trend following, breakouts, and range trading strategies depending on market conditions. The Indicator’s default period is 20, however traders may customize it to their preference or to optimize the strategy. For traders to build and backtest trading strategies, the indicator is offered on the Streak platform.
Disclaimer: The information provided is solely for educational purposes and does not constitute a recommendation to buy, sell, or otherwise deal in investments.