

Overbought and Oversold technique is very useful for trading in sideways markets and getting favorable entries in trending markets.
When the market is overbought, there is a greater chance of price collapse and when the market is oversold, there is a greater chance of a bullish move. Hence overbought and oversold conditions are important tools that can help traders identify potential reversals in the market.
Learning about over-bought and over-sold conditions can also help investors evaluate the strength or weakness of a stock trend.
What are overbought and oversold conditions?

Overbought refers to a period when there has been a strong and consistent upward movement in price over a period of time with little or no correction. Oversold refers to a period when there has been a strong and consistent downward movement in price over a period of time with little or no pullback.
Identifying overbought and oversold conditions

Identifying overbought/oversold conditions with RSI

Overbought Condition: RSI is above 70
Oversold Condition: RSI is below 30
70 and 30 are most commonly used levels. Some traders may use different thresholds for over-bought and over-sold levels, depending on their trading strategies and risk tolerance, volatility of the instrument, historical performance etc. The best way to find suitable levels is to backtest the strategy with different over-bought and over-sold levels.
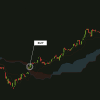
Identifying overbought/oversold cond. with Bollinger Bands

Overbought Condition: Candle is formed above the upper band
Oversold Condition: Candle is formed below the lower band
Strategy Example 1

Strategy Link: bit.ly/streakos2
Video Explanation:
Strategy Example 2

Strategy Link: bit.ly/streakos1
Video Explanation:
Scanner Example 1
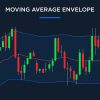
Scanning oversold stocks as per Keltner channel indicator.

Scanner Link: bit.ly/streakos3
Video Explanation:
Scanner Example 2:
Scanning overbought stocks on the daily timeframe with a bearish condition on 5 min timeframe.

Scanner Link: bit.ly/streakos4
Video Explanation:
Conclusion
- Over-bought and over-sold conditions are not buy or sell signals, but rather a warning that the market has reached an extreme level and may reverse direction.
- Over-bought or over-sold conditions can be temporary, with prices continuing to increase or fall even after reaching these levels.
- Other technical analysis tools, such as support and resistance levels, trendlines, and chart patterns can be used along with over-bought and over-sold conditions to improve trading decisions.
- Over-bought and over-sold conditions can be identified in different time frames. For example, a stock may be over-bought in the lower and over-sold in the higher time frames at the same time.
Disclaimer: The information provided is solely for educational purposes and does not constitute a recommendation to buy, sell, or otherwise deal in investments.