
The Ichimoku Cloud, a great gift the Japanese gave us other than the CandleStick charts.
So open up your price charts and apply the Ichimoku to your favorite stock! At first glance the Ichimoku Cloud looks pretty crowded and ugly and a lot of lines and fillings. Many traders like to keep their charts clean and follow a few strong indicators they’ve adjusted to. But then, of course, there’s a lot more to the Ichimoku than you can imagine. So let’s deep dive into this Japanese indicator.
Components of Ichimoku
First, this indicator combines multiple indicators in a single chart. It is a partial leading & a partial lagging indicator and can be used as a forecasting tool. It also gives insights into potential support and resistance zones. The Ichimoku Cloud was conceptualized in the late 1930s by a Japanese journalist named Goichi Hosada. Hosada called it Ichimoku Kinko Hyo, which translates from Japanese as “equilibrium chart at a glance.” The following are the components:
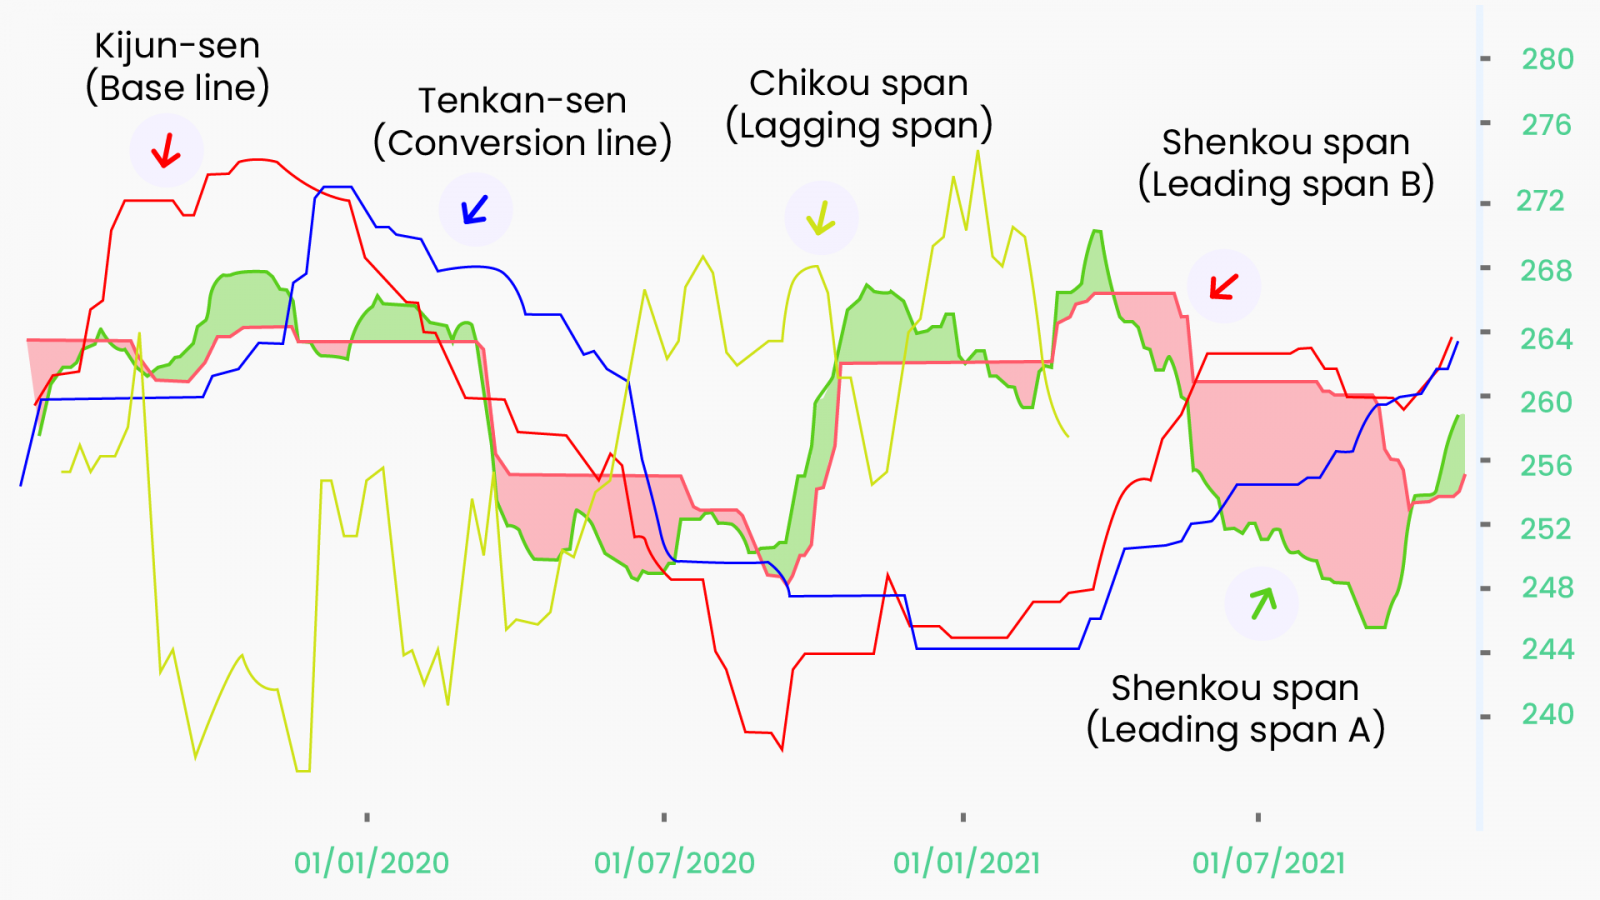
- Conversion Line (Tenkan-sen): 9-period moving average.
- Base Line (Kijun-sen): 26-period moving average.
- Lagging Span (Chikou Span): the closing price of the current period projected 26 periods in the past.
- Leading Span A (Senkou Span A): the moving average of the Conversion and Base Lines projected 26 periods in the future.
- Leading Span B (Senkou Span B): 52-period moving average projected 26 periods in the future.
It is important to note that unlike other methods, the moving averages used by the Ichimoku strategy are not based on the closing prices of the candles. Instead, the averages are calculated based on the high and low points recorded within a given period (high-low average). For instance, the standard equation for a 9-day Conversion Line is: (9d high + 9d low) / 2
- Ichimoku Cloud (Kumo Cloud): The space between the Leading Span A & Leading Span B is what produces the cloud.
This Kumo Cloud is the most notable element of the Ichimoku system. The two lines are projected 26 periods in the future to provide forecasting insights and, as such, are considered leading indicators. The Chikou Span, on the other hand, is a lagging indicator projected 26 periods in the past. By default, the clouds are displayed in either green or red – to make the reading easier. A green cloud is created when the Leading Span A (green cloud line) is higher than Leading Span B (red cloud line).
Gosada spent over 3 decades testing the Ichimoku and concluded that the (9, 26, 52) settings had the best results. Back then, the Japanese business schedule included Saturdays, so the number 9 represents a week and a half (6 + 3 days). The numbers 26 and 52 represent one and two months, respectively.
Analyzing the Inchimoku
The Ichimoku has so many elements that we will have to divide it into 2 major categories:
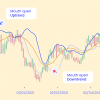
- Momentum signals: The Base Line and Conversion Line are responsible for giving momentum signals. Bullish Momentum signals are produced when either or both the Conversion Line and the Price Line move above the Base Line. Bearish Momentum signals are generated when either or both Conversion Line and Price Line move below the Base Line. The crossing between the Conversion Line (Tenkan-sen) and the Base Line (Kijun-sen) is often referred to as a TK cross.
- Trend-following signals: The color of the cloud & its position compared to the price is responsible for giving trend signals. As mentioned, the cloud color reflects the difference between the Leading Spans A and B.
Simply put, when prices are consistently above the clouds, there is a higher probability that the asset is in an upward trend. In contrast, prices moving below the clouds may be interpreted as a bearish sign, indicating a downtrend. The trend may be considered flat or neutral when prices are doing sideway movements inside the cloud.
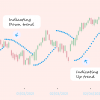
The Lagging Span (Chikou Span)helps spot potential trend reversals. The trend is bullish when its moving above the stock price and bearish trend when its moving below the price. It is used in conjunction with the other components of the Ichimoku Cloud, and not on its own.
The Ichimoku chart can also be used to identify support and resistance zones. The Leading Span A (green cloud line) acts as a support line during uptrends and as a resistance line during downtrends. In both cases, the candlesticks tend to move closer to the Leading Span A, but if the price moves into the cloud, the Leading Span B may also act as a support/resistance line. What’s more, the fact that both Leading Spans are projected 26 periods in the future allows traders to anticipate potential coming support and resistance zones.
Ichimoku, with shorter timeframes (intraday charts) tends to generate a lot of noise and false signals. Generally, longer timeframes (daily, weekly, monthly charts) will produce more reliable momentum and trend-following signals.
By now you must have noticed that this indicator gives so much more information. And ig you are a beginner, it mught get overwhelming to digest the signals.
A Quick Recap
- The Kijun/Tenkan aka TK Cross – This works in a similar fashion to the moving average crossover.
- Confirm Down/Uptrend With Chikou – This works in a similar fashion with a momentum oscillator.
- Price Action Should Break Through the Cloud – The downtrend or uptrend should make a clear breakthrough of the “cloud” of resistance or support.
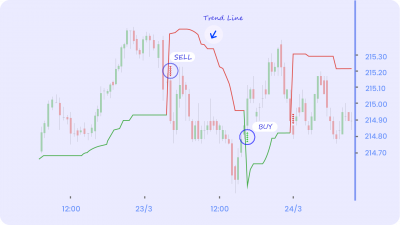
- Buy Signals – Price rises above the Komu or cloud; Kumo turns from red to green; Price moves above the Kijun Sen; Tenkan Sen rises above the Kijun Sen
- Sell Signal – Price falls below the Komu or cloud; Kumo turns red from green; Price moves below the Kijun Sen; Tenkan Sen falls below the Kijun Sen
Limitations of Using the Ichimoku Cloud
Now that we have all the good stuff out of the way, buckle yourself to hear about a few negatives. Also, it is important to note that one indicator is not better than another. They just provide information in different ways.
- The indicator might clutter your price chart and can get really distracting.
- The averages are simple being plotted into the future without a proper formula
- The cloud might get irrelevant as the price remains way above or way below it
Happy Trading! 😄