
Intraday traders love momentum. Momentum allows traders to enter and exit their position quickly with a profit/loss. There are various indicators that traders use to gauge momentum, for example, the Relative Strength Index. In my last article, we discussed the Dynamic Contract feature and how to create Straddle in Streak. In this article, we will be discussing the Stochastic oscillator, another indicator that can help you to detect momentum. It was developed by a group of Chicago-based traders in the 1950s. The term “stochastic” refers to the location of a current futures price in relation to its range over a set period of time.

Now before we begin understanding the formula, note that there are two types of stochastic oscillator supported by Streak, i.e Fast and Slow stochastic. Now, this is what most new users get confused with. Because the Fast and Slow stochastic does not mean the %k and %d line. %k line is also known as the fast line and %d as the slow line. But when we talk about Fast and slow stochastic, we are referring to two slightly different variations of the stochastic oscillator. Let us understand this by studying the formulas.
Formula
Fast Stochastic
%K = 100*[(Current Close – Lowest low of the X period) / (Highest High of the X period – Lowest low of the X period)]
%D = Y period SMA of %K
Note the default parameter of stochastics is (14,3) i.e (X=14,Y=3).

Let us now understand the formula of slow stochastics. For simplicity purposes, the %K of slow stochastics is displayed as %K‘, read percentage K-dash.
Slow Stochastic
%K = 100*[(Current Close – Lowest low of the X period) / (Highest High of the X period – Lowest low of the X period)]
%K' = Y period SMA of %K
%D' = Y period SMA of %K'
Now, the slow stochastic named so because the %K line of Slow stochastic is basically the %D line of Fast stochastic, which is an average, hence Slow. And both the two types have a fast line(%K, %K‘) and a slow line (%D, %D‘).

Now you can understand why this is confusing and in case it is not clear, read this section twice. Now on to the more easy part how to interpret and use them in Streak.
Interpretation
There are generally two common ways of using this indicator.
Overbought/Oversold level
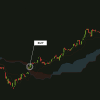
The value of the Stochastic Oscillator is bound between 0 and 100. Generally, a value over 80 is considered as overbought and a value lower than 20 is considered as oversold. Of course, you can adjust levels as per your own need. A value above 80 for a 14-period Stochastic Oscillator indicates that the price is trading near the high end of its 14-period high-low range. Similarly, a value below 20 indicates that the price is trading near the low end of its 14-period high-low range.
Crossovers
When %K crosses above %D, it is considered as the start of an uptrend. Similarly, when %K crosses below %D, it is considered as the start of an downtrend.
How to implement Stochastic in Streak
Now before we go ahead and create a condition, we need to understand what parameters needs to be set for both Fast and Slow stochastic.

Note that the parameter “Smoothen” is set as No, which means, no moving average will not be applied while calculating %K. This setting is used for implementing Fast Stochastic.

Similarly for setting Slow stochastic, the parameter “Smoothen” is set as Yes, which means, a 3-period moving average will be applied while calculating %K.
Note: That Streak does not allow changing the moving average period. The default value of 3 is considered and cannot be changed.
Creating a mean-reverting strategy in Streak
Here is the condition for creating a Short strategy for when an instrument is trading in the overbought region.

This makes it a mean-reversion strategy where we are assuming since the instrument is overbought it will fall down, hence, mean-reverting. Now let us backtest this on a couple of stocks and see the result.

We can see that using the above-discussed condition gave good results for some stocks while for some it gave loss-making trades. No indicator can always give profitable trades, hence a healthy practice of using multiple indicators and playing around with the parameters, and adjusting level helps. while keeping in mind that too much of modification may result in curve-fitting.
Stochastics gives very good and quick entry triggers but gives many false signals because it gives a faster indication. Using this oscillator with a combination of trend following indicators may reduce false signals.
Hope this was informative and helped people demystify the confusing terms. Try backtesting using the indicator or using it as a part of your strategy and see if you can create a profitable strategy. If you want me to write more such articles on any particular indicator, write in the comments below.


Pingback: Risk Management and Position Sizing in Streak - Streak Tech