
For the last 5 years, we have made systematic trading as simple as it can get. Just when we thought it CANNOT get easier, we wanted to break the glass ceiling and create something groundbreaking! ONE CLICK to see backtest results.
We keep pushing the boundaries to make technical-based trading accessible to everyone. This time we are excited to bring this new feature right on your Kite charts!
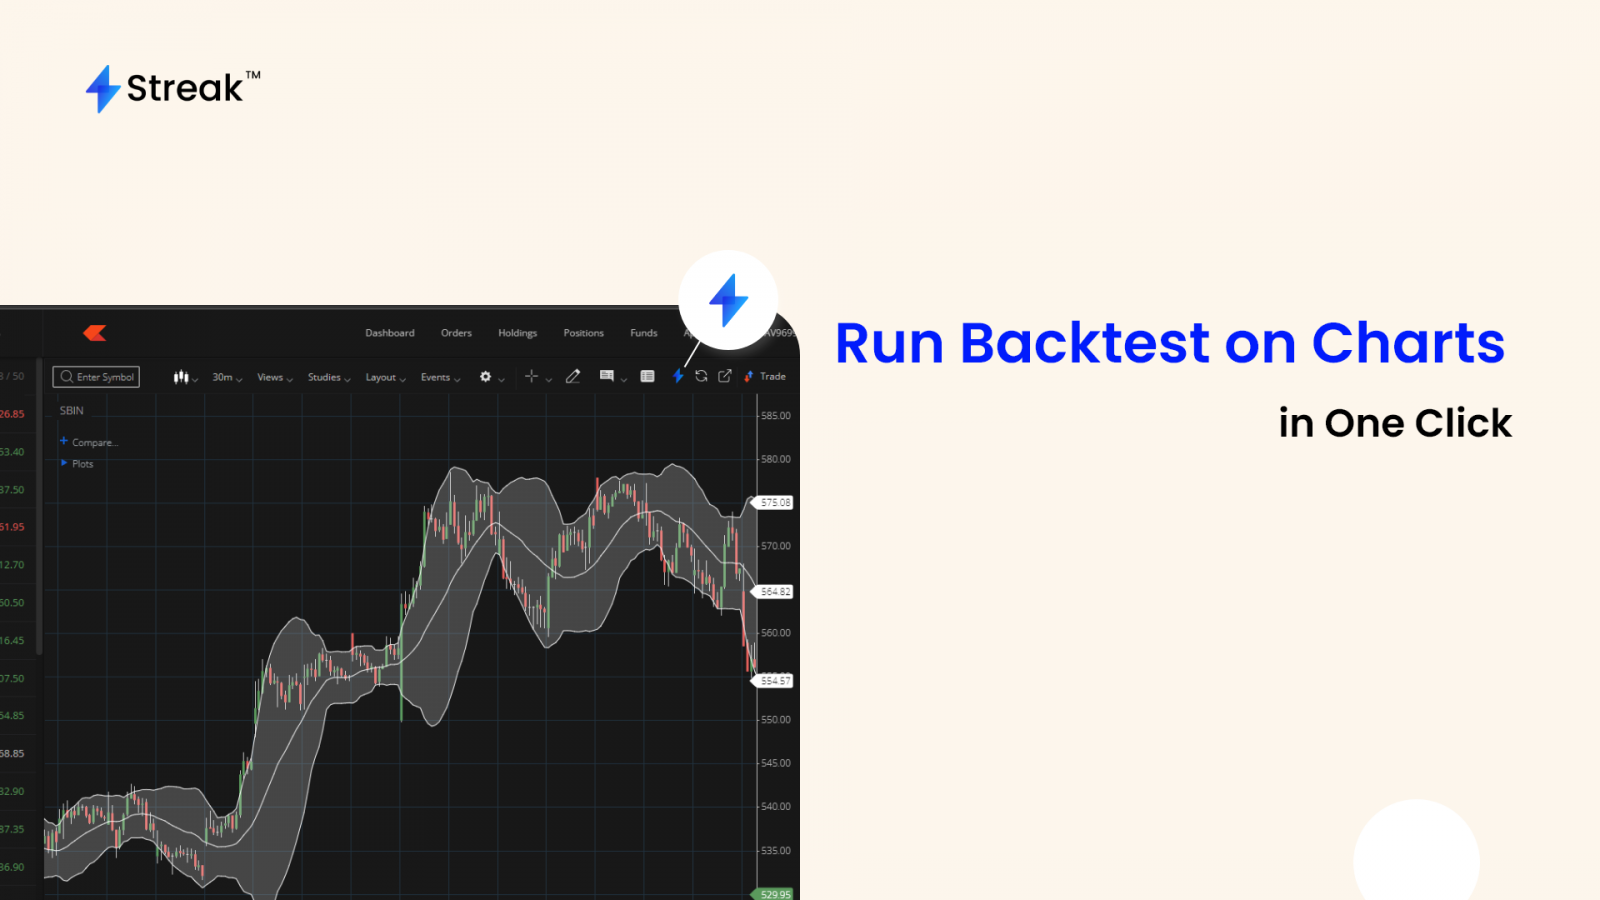
With one click, you’ll be able to see how the indicator that you’ve plotted has performed over a period of time. Our system captures the parameters you’ve set on the chart and instantly converts a complex-looking chart into a possible trading strategy. It then runs a backtest on historical data to present the backtest result to you. All of this happens in a matter of seconds.
Let’s look at an important step you’ll need to follow to set this up (refer to the image below):
Step 1: Log in to Kite
Step 2: Go to the Profile section
Step 3: Change chart type to the all-new Chart IQ version 8

Now let’s look at various scenarios you can use this for:
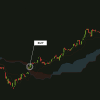
Scenario 1: If you have applied an indicator on a Kite chart

In the example above, we have opened the candlestick chart for SBIN, applied the Supertrend indicator and selected a 15 min time frame, and clicked on the STREAK logo. It immediately redirects to the Streak platform and runs backtest and gives you the results in an instant.
As you can see, the indicator, time interval, and stock/instrument you’ve chosen get captured and a backtest with default parameters is run on the Streak platform. The process is smoother if you’ve logged into Streak on the browser beforehand.
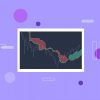
Scenario 2: If you have applied more than one indicator

If you have plotted more than one indicator, which is a very common use case, the system intelligently combines the indicators in the most commonly used way and presents the backtest results. However, once the backtest has run, you can always edit any parameter you like as shown in the next step below.
Change backtesting parameters and edit the strategy

As shown above, you can add more stocks to this strategy, and change the Stop Loss or Target profit capital allocation, time frame, duration, etc as per your requirement.
You can even change the Entry conditions or the way they are combined, for example: “AND” can be switched to “OR”. You can also add more Entry conditions or Exit conditions as well. You can do all this from the panel on the right.
Scenario 3: If no indicator has been applied

If no indicator has been applied, the platform runs a default Price Action strategy.
This feature is specially designed for traders who are exploring the world of technical analysis and want to explore strategies that can be created using technical indicators.
Technology has changed the world of retail trading as we know it. Our aim is to bring everyone on a level playing field where they can take the best advantage of the latest trading technology.
Offer: Run 10 backtests(from charts) for free every day if you are a Kite user.
To get started with Streak visit us at https://streak.tech